Modeling spinal cord motor activity
Spatial distribution of hand-grasp motor task activity in spinal cord functional MRI
The spinal cord is essential for transmission of sensorimotor information in the human body, such as sending motor commands from the brain to the body. I use functional magnetic resonance imaging (MRI) to characterize these movement-related neural signals in the human spinal cord. Functional MRI is an indirect measure of activity, sensitive to local blood flow changes induced by neural activity. We can use signal and image processing techniques to characterize this neural activity in the human spinal cord. More commonly, this method has been used to study the brain. In the spinal cord, there are additional challenges such as the influence of physiological noise (cardiac, respiratory) on the MRI signal, which require advanced signal denoising techniques to remove the effects of this noise.
The MRI experiment
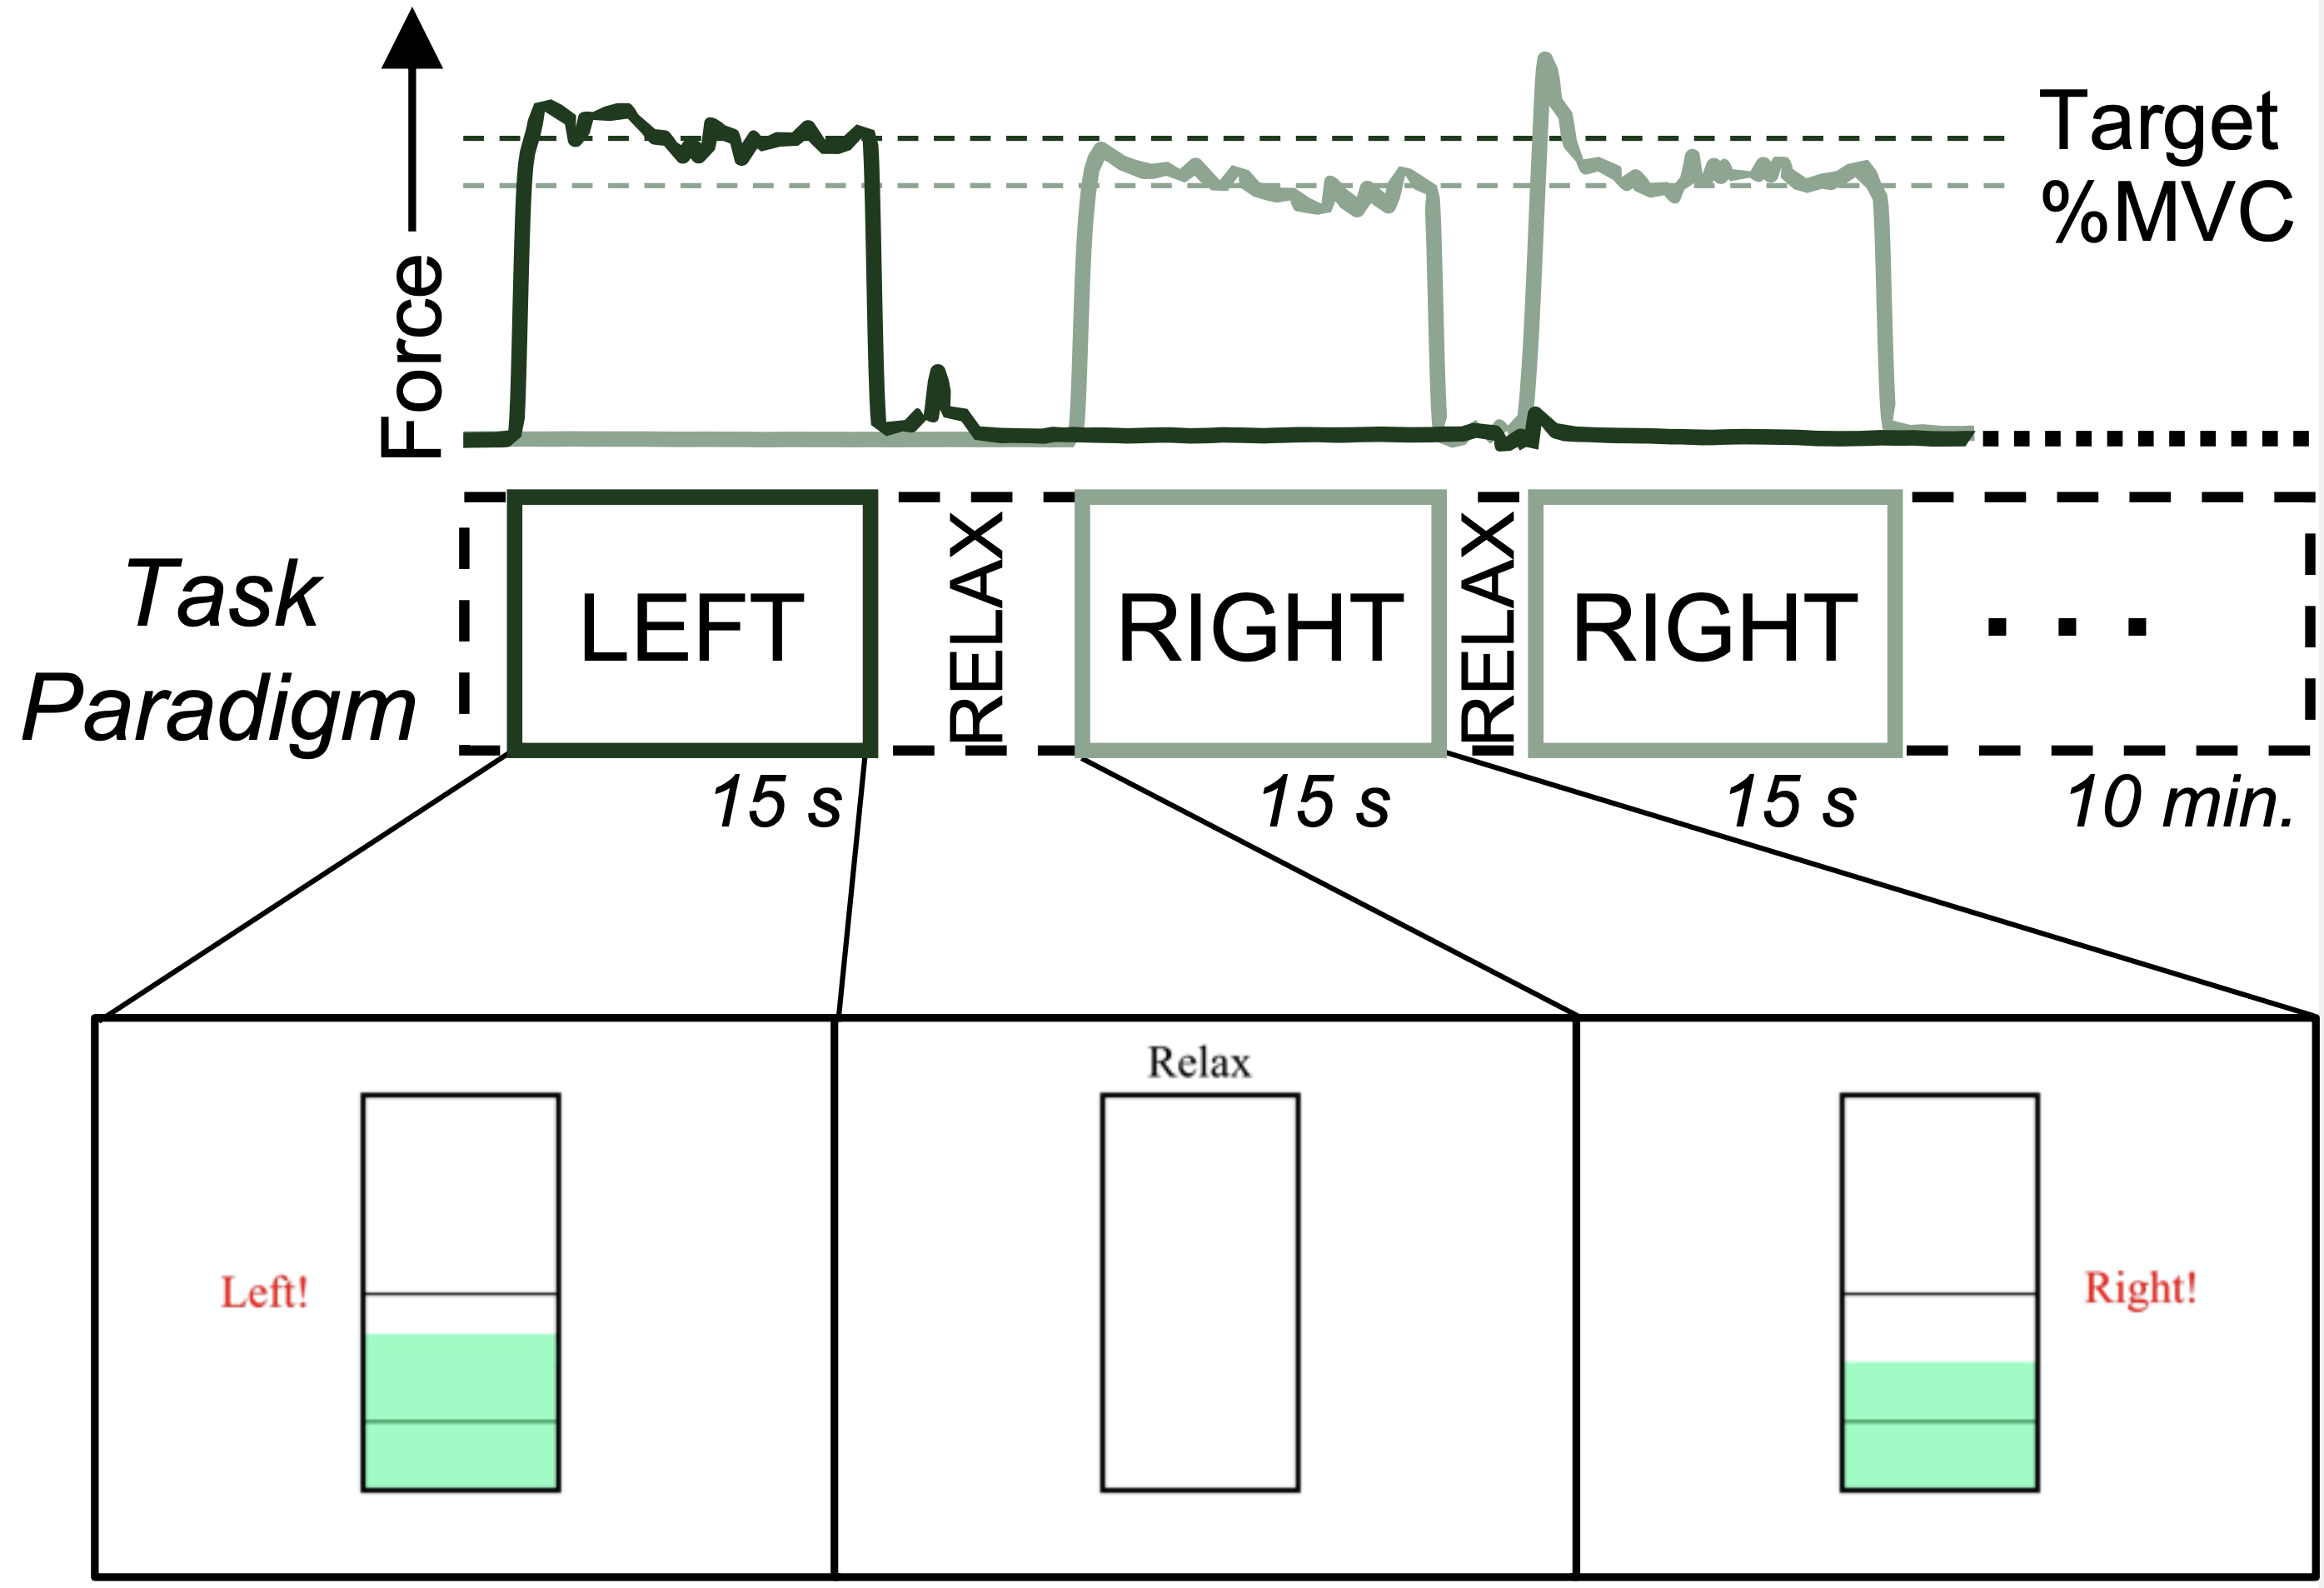
In this study, 26 participants performed a hand-grasping task during an MRI scan. Below is an example of that task including the actual grasping force collected during the MRI and the live visual feedback seen during the task. For 10 minutes, participants were instructed to squeeze a handgrip device for 15 seconds at a time, targeting a percentage of their maximum voluntary contraction, or MVC. We also recorded other physiological data from participants including their exhaled CO2, breathing and heart rate.
Modeling neural motor activity
The functional MRI analysis uses a voxel-wise GLM approach. (Many preprocessing steps are performed to the data before this stage, see paper for more details.) Each voxel (3D pixel) in the spinal cord image has a time series that is fit to a design matrix of explanatory variables. These include the hand-grasping task and nuisance regressors:
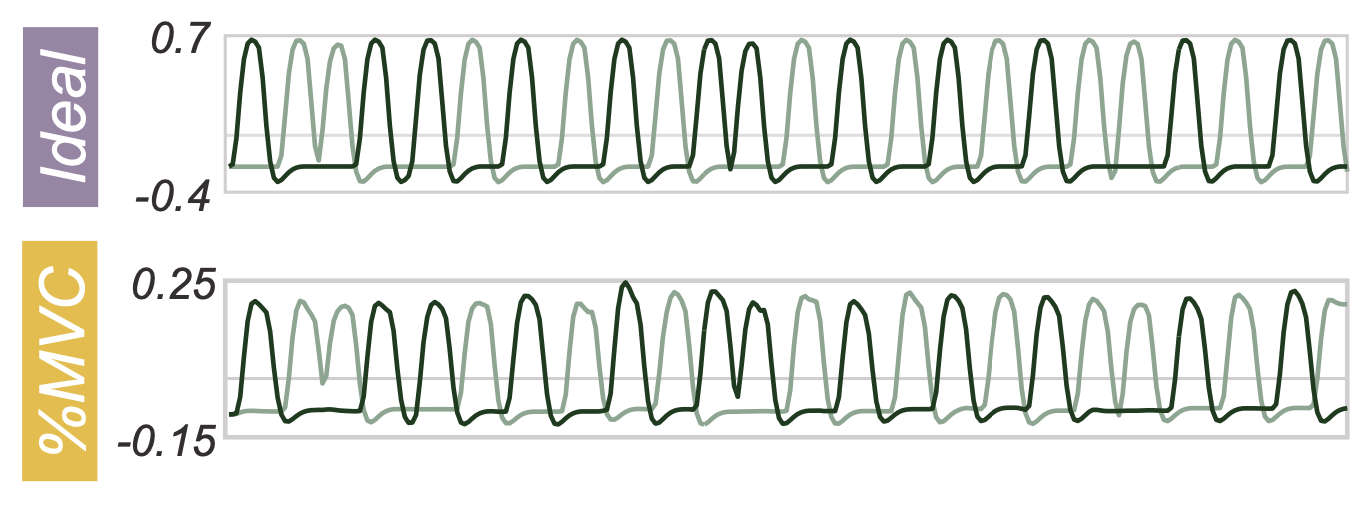
Task: I tested how a couple different task models affect the spatial distribution of activity that could be detected. A typical way to model functional MRI signals is to generate a binary vector of task On/Off periods (“Ideal” regressor). Since I also had force data time locked to the MRI scans, I used this to create a trace normalized to the individual participants maximum grasping effort (“%MVC” regressor). Each of these models were then convolved with a canonical hemodynamic response function to provide an estimate of how we expect the signal time series to look in the cord.
Nuisance: I also included a number of nuisance regressors to combat the amount of physiological noise in the MRI signal. These regressors are intended to fit unwanted noise in the signal and are derived from the recorded physiological signals (CO2, breathing, and heart rate) or through data-driven techniques such as principal component analysis, or PCA.
Mapping motor activation
From the GLM, the parameter estimate associated with the task regressor is used to create activation maps, which in this case are statistical maps of significant spinal cord activation associated with hand-grasping. I combined parameter estimate maps across participants and performed nonparametric t-tests.
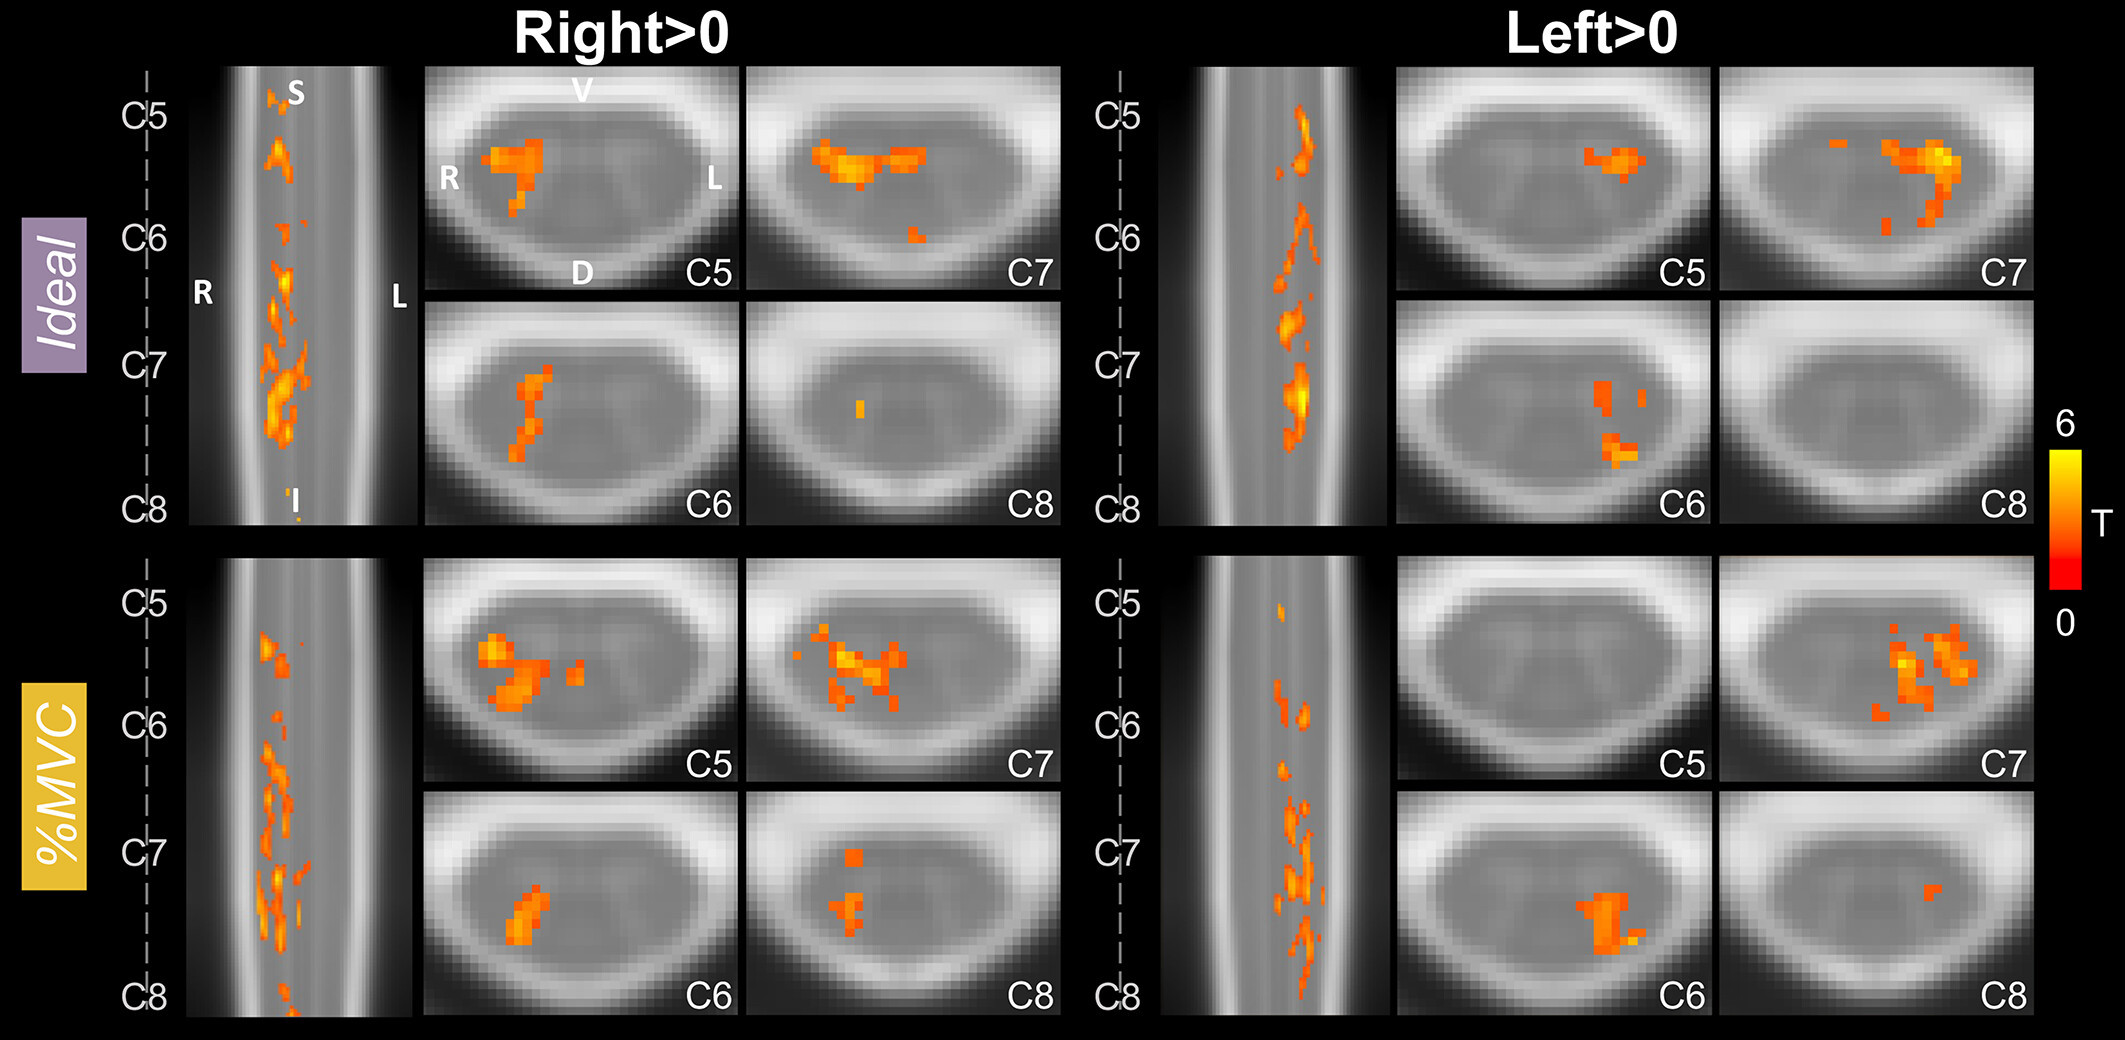
Motor activity for this task was expected to peak in the ventral horn of the C7-C8 spinal cord segments, ipsilateral to the side of the task. (Based on spinal cord anatomy, see paper for more details.) It is clear that activation from grasping with the right hand (Right>0) is localized to the right side of the cord, and vice versa. This is the first spinal cord MRI work to come out of our lab and I was excited to present this robust and highly lateralized activation.
I further explored the spatial distribution of motor activity in a few relevant spinal cord regions of interest (ROIs):
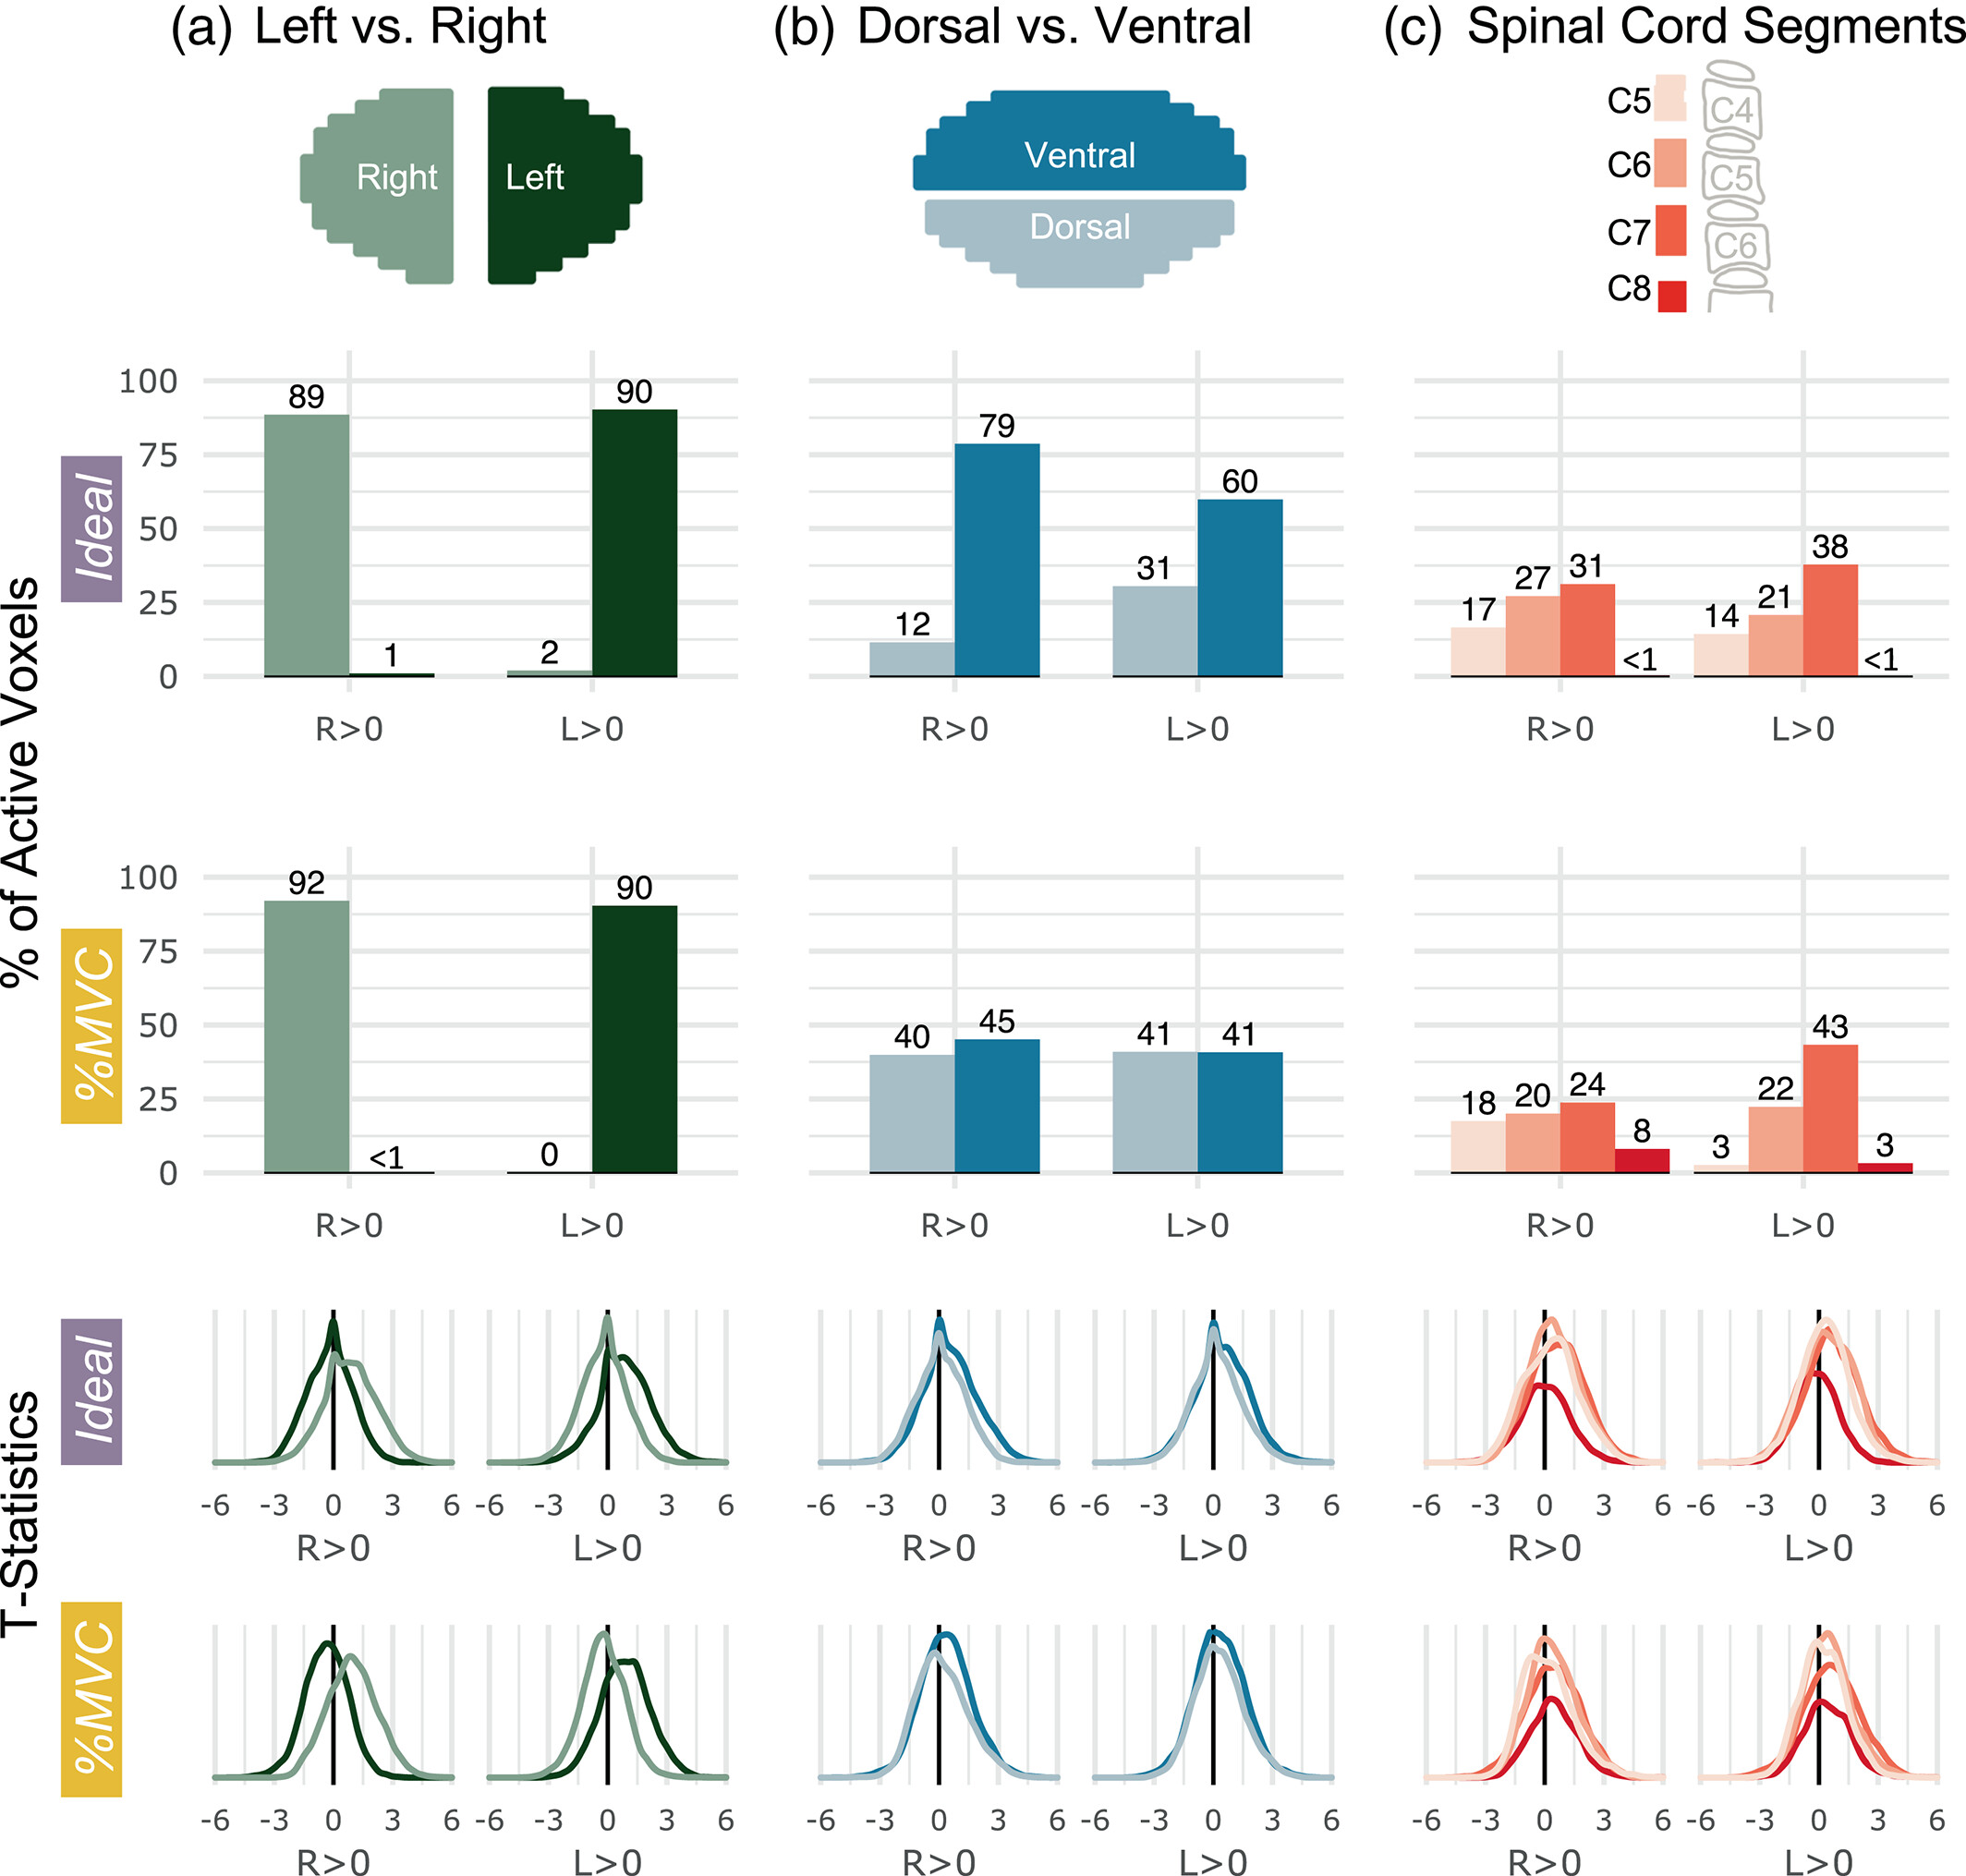
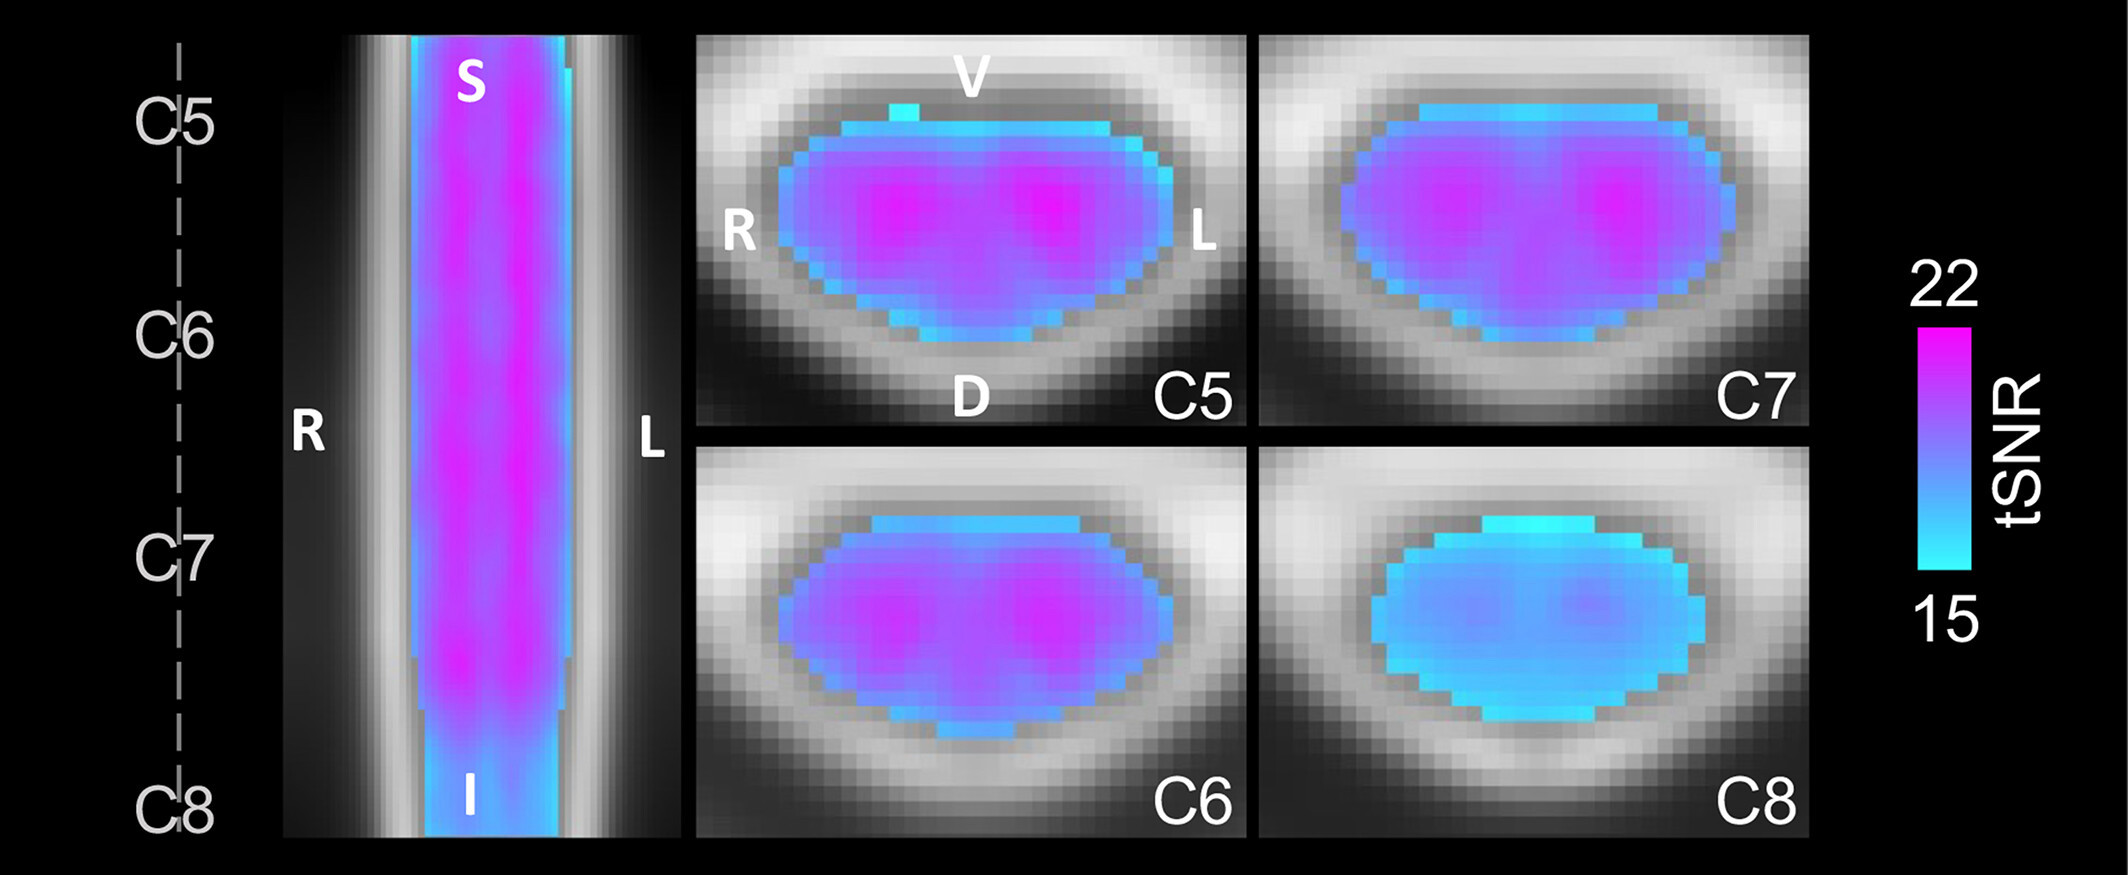
One notable feature is the decrease of activity in the C8 ROI, where we initially hypothesized to see more activity. So, I created a group map of the temporal signal to noise ratio (tSNR), which is a metric of signal quality based on the functional MRI time series. In that C8 region there is a notable decrease in tSNR compared to the rest of the spinal cord, which likely contributes to the amount of activation we are able to detect.
In this work, I presented a couple of different task models: the typically used Ideal model and our %MVC model. Either one captures hand-grasping motor activity in the spinal cord reasonably well. However, the %MVC model retains intra- and inter- individual variability in participant task performance. Therefore, this individually calibrated model may be especially beneficial in patient cohorts with motor impairments.
Thanks to all my co-authors!
Data visualizations above were created with R and spinal cord maps were visualized with FSL.
November 10, 2023